 In this part, the Part 4 of my article on LBO, I’m going to run you through its economics – the metrics used to judge an LBO candidate and how it generates returns. But before reading further, you may want to take a glimpse of my previous articles on LBO through the following links so that we’re on the same page.
Part1: Leveraged Buyout – An Overview
Part2: Leveraged Buyout – What Makes a Strong LBO Candidate?
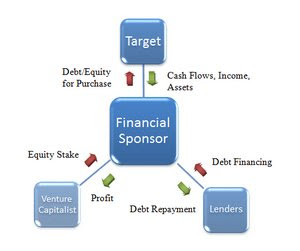
Part3: Leveraged Buyout – Key Participants
Metrics Used To Judge An LBO Candidate
There are two metrics that defines the attractiveness of an LBO candidate – (1) Internal Rate of Return (IRR), and (2) Cash Returns.
IRR is the primary metric that measures the total return on the sponsor’s equity investment (which includes additional capital infused or dividends received) during the investment period. For everybody’s benefit, an IRR is the discount rate at which NPV of all the cash flows (inflow and outflow) becomes zero.
The drivers that affect IRR are:
- target’s financial performance
- acquisition price
- financing structure, especially the equity contribution made
- exit multiple, and
- holding period.
As mentioned in my first article – LBO: An Overview –, a sponsor seeks a minimum of 20% return on their investment over their holding period of five years. So, it’s obvious (looking at the drivers of IRR) that minimizing the equity contribution and acquisition price, while exiting at a higher valuation by boosting the financial performance of the target, fetches handsome returns.